
Infographic Design Services for Clear, Credible Communication
We transform complex data, programme insights, research findings, and field evidence into clear visual stories for NGOs, development organisations, government projects, and educational institutions.
FEATURED INFOGRAPHIC WORK
Research, data and public information shaped into visual stories.
These examples show two different infographic approaches: a data-rich survey summary designed for rapid scanning, and a chronological visual narrative built around a person’s life and contribution.
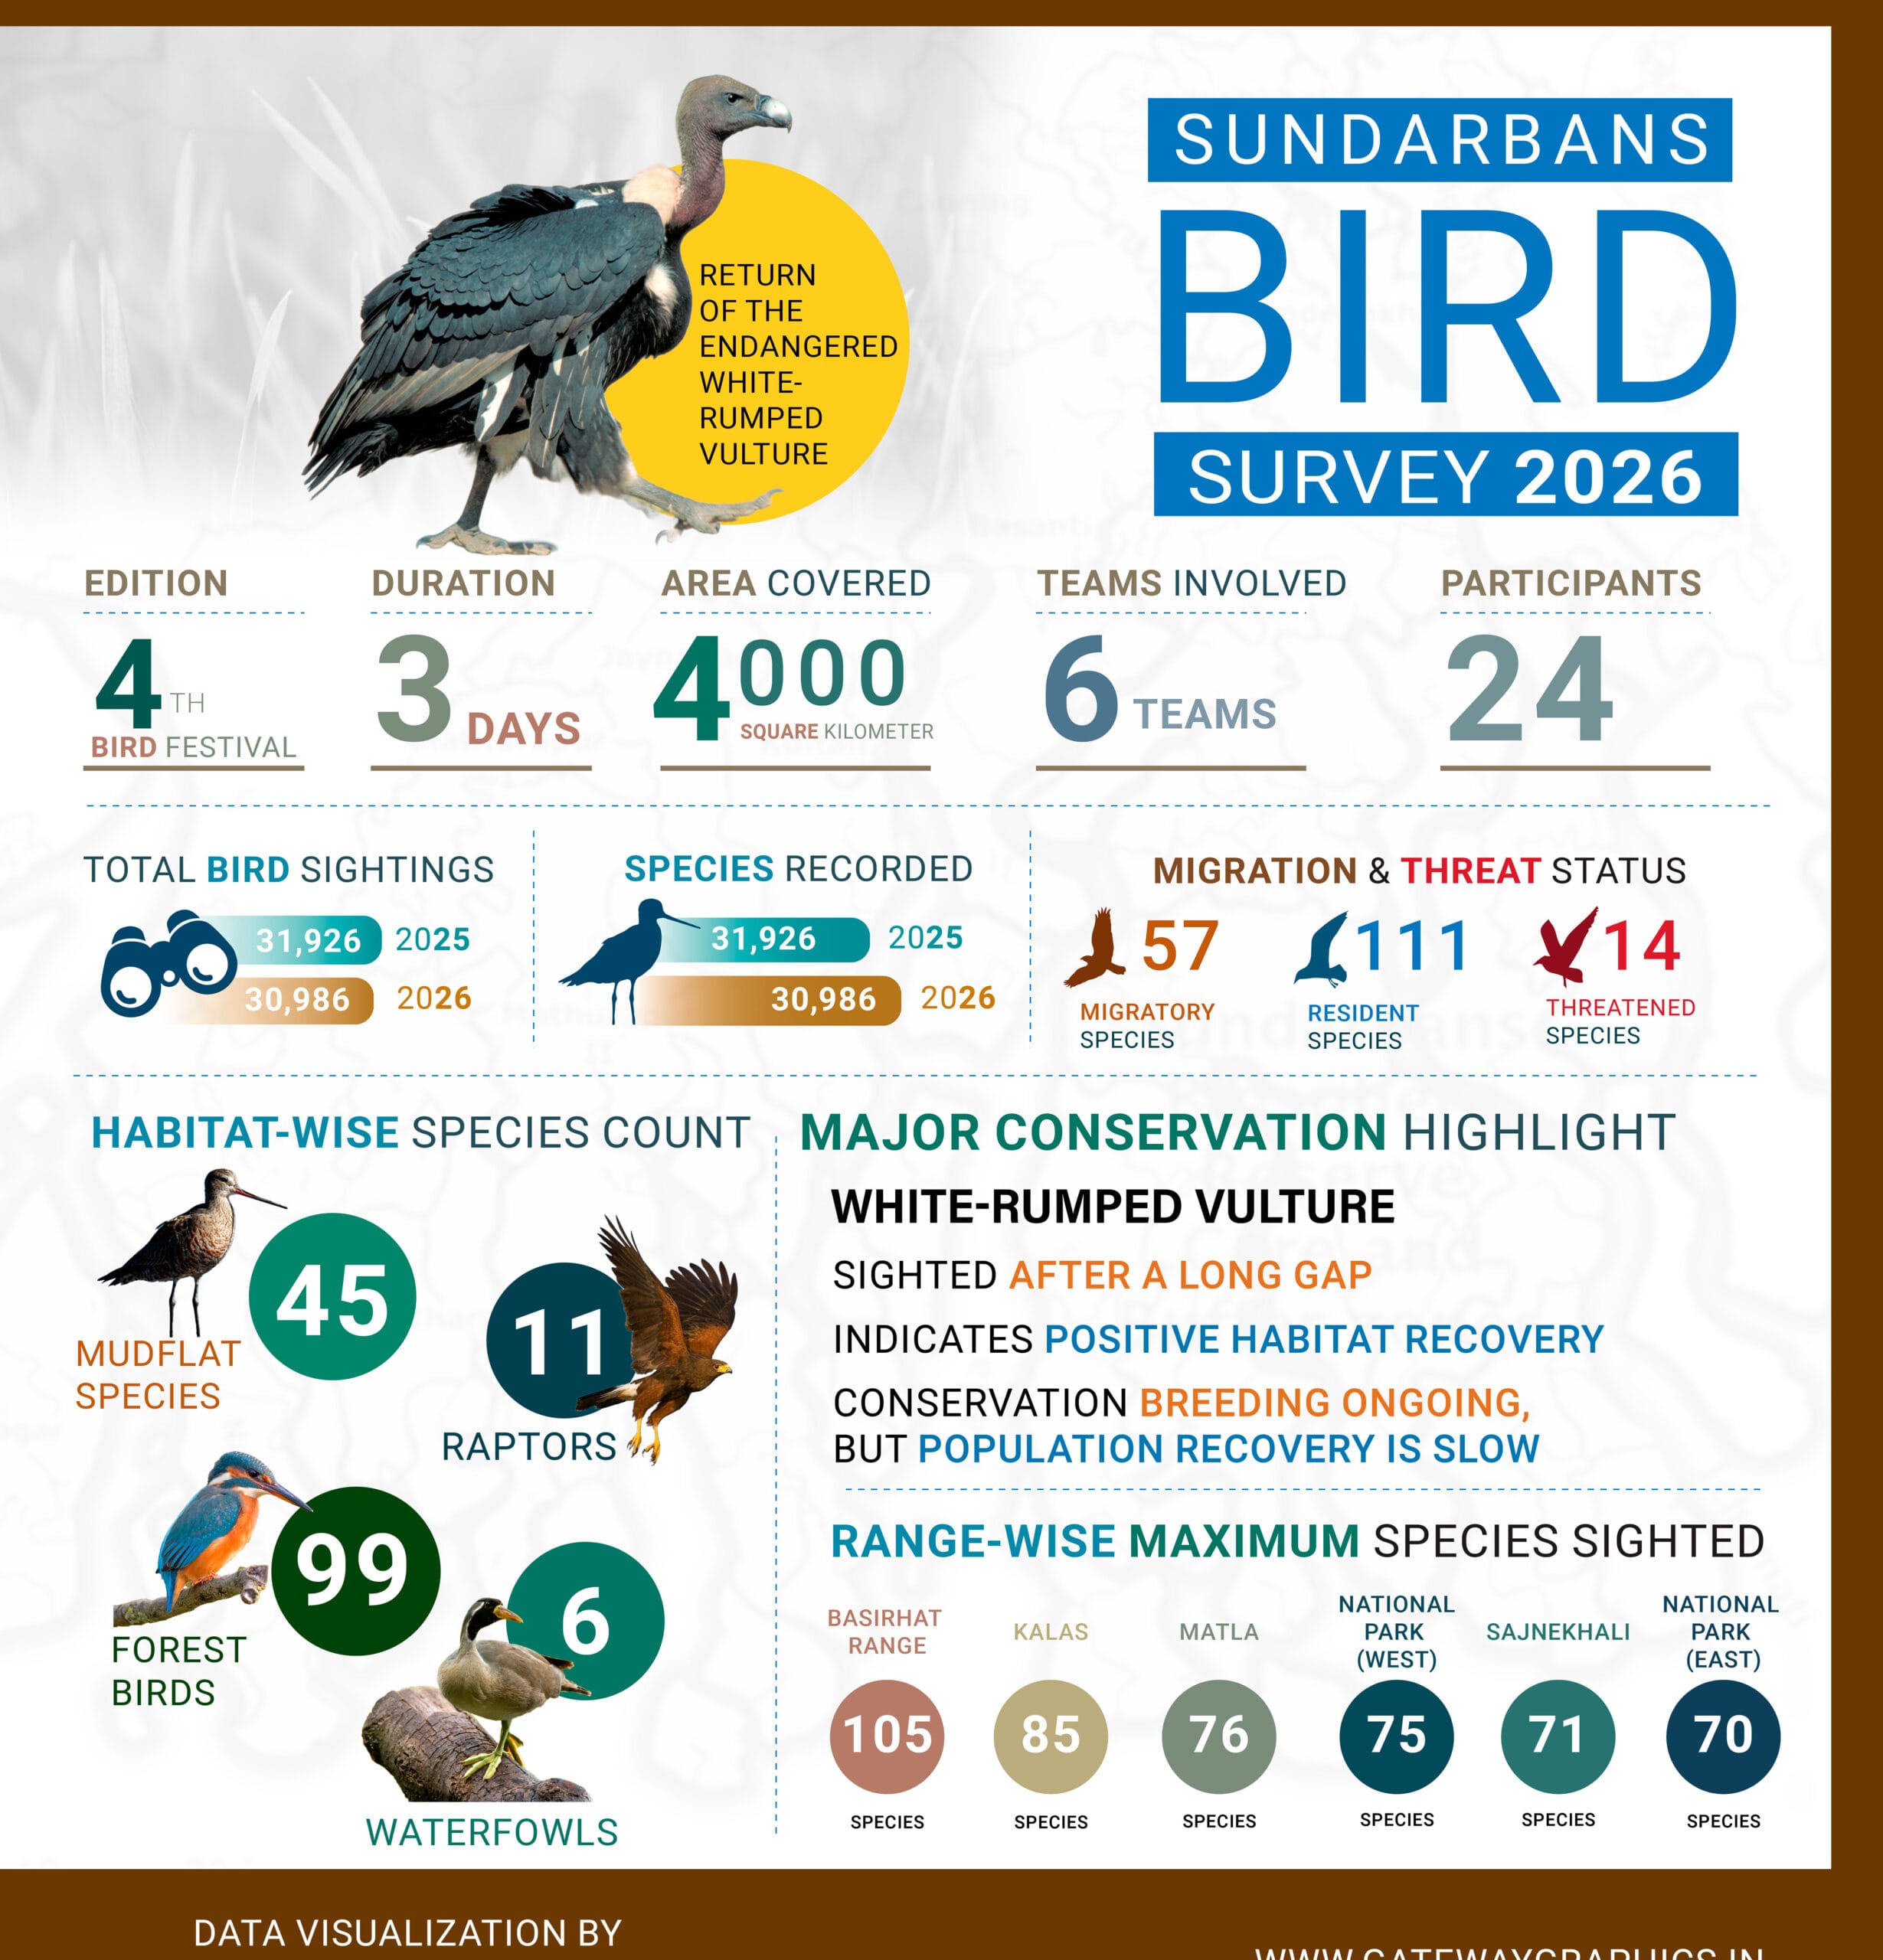
Sundarbans Bird Survey 2026
Survey scale, participation, sightings, species categories and conservation highlights organised into a single visual hierarchy for quick public understanding.
- Multiple statistics on one page
- Icon-led species information
- Comparison and conservation highlights
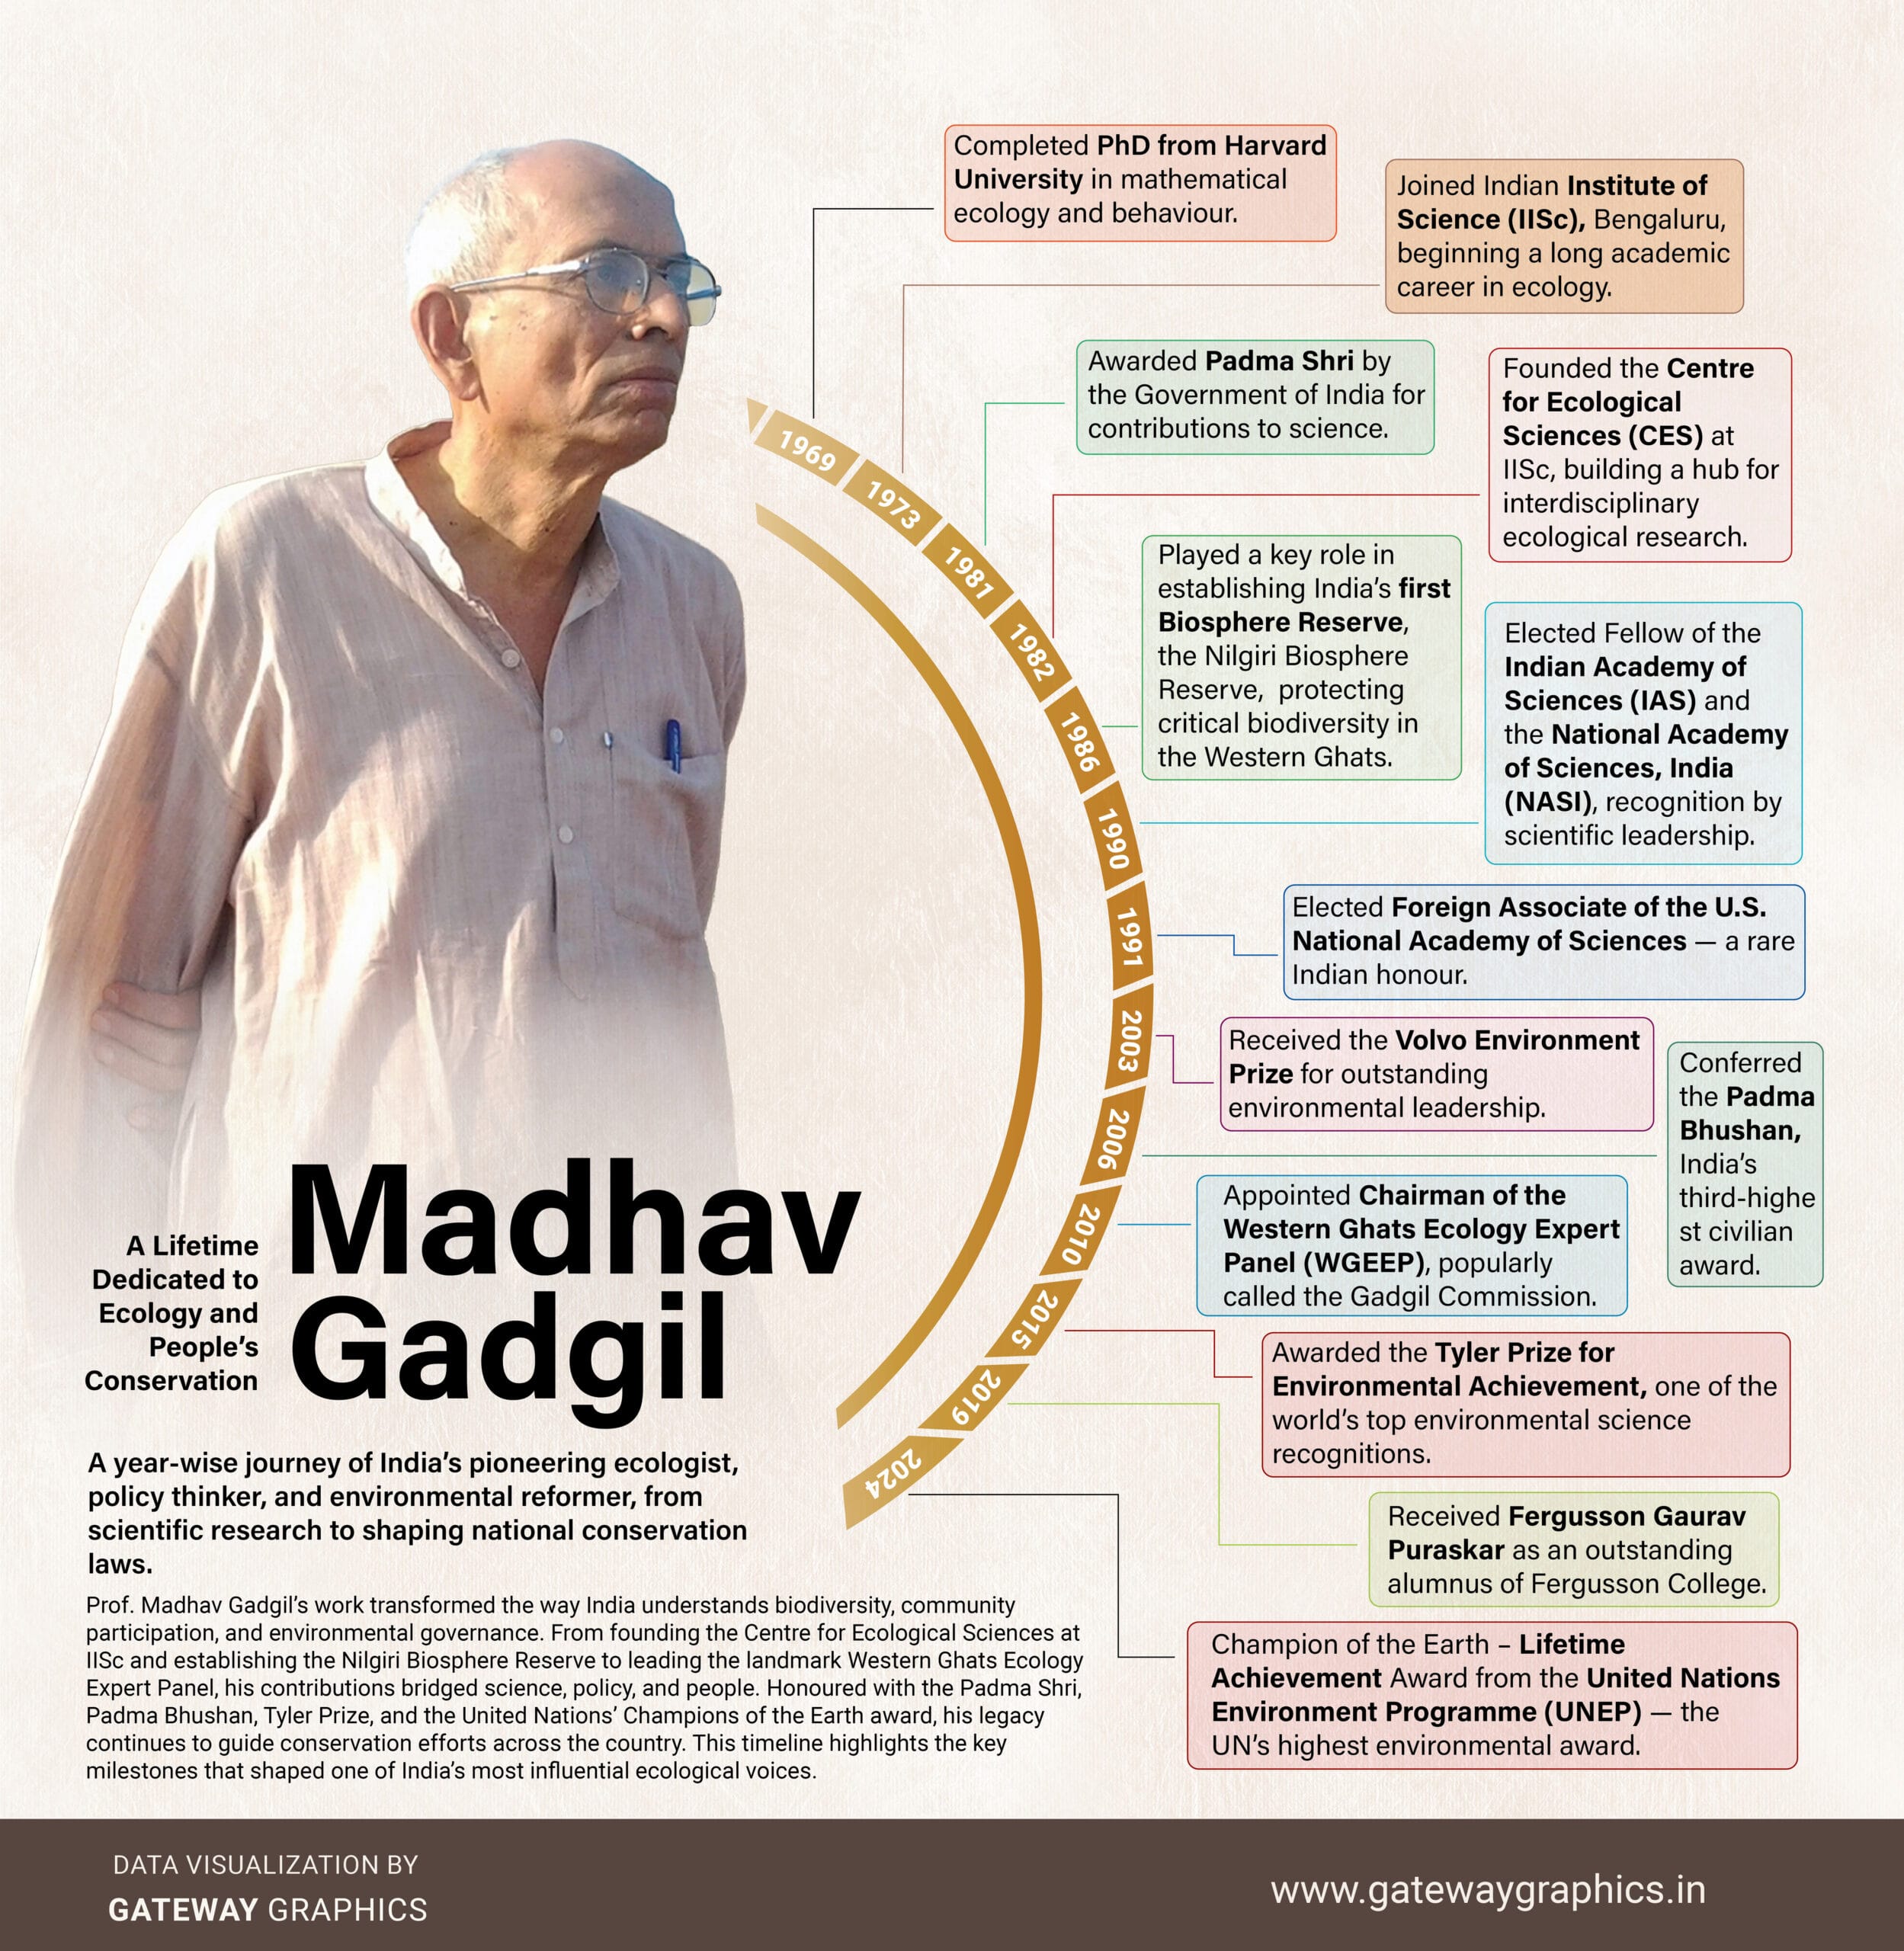
Madhav Gadgil: A Life in Ecology and Conservation
A year-wise journey through academic work, ecological research, public policy, awards and conservation leadership—structured as an accessible visual timeline.
- Chronological information architecture
- Portrait-led narrative
- Milestones grouped for easy reading
MORE VISUAL COMMUNICATION
Information designed for different formats and audiences.
Make Complex Information Easy to Understand
Good information design does more than decorate data. It helps readers see patterns, understand outcomes, and act with confidence. Gateway Graphics combines editorial thinking, visual hierarchy, data visualisation, and development-sector understanding to create infographics that are accurate, accessible, and ready for real communication use.
We can work from reports, spreadsheets, survey findings, monitoring data, research notes, or an early brief. Our team helps organise the information, identify the central message, and build a visual structure suited to your audience and channel.
Data & Impact Infographics
Visual summaries of programme results, indicators, reach, outcomes, and evidence for reports, proposals, presentations, and donor communication.
Process & System Visualisation
Clear diagrams, timelines, frameworks, theories of change, workflows, maps, and step-by-step visual explanations.
Campaign & IEC Graphics
Audience-friendly visual content for awareness campaigns, training resources, social media, community communication, and public engagement.
What We Deliver
- Report and annual-report infographics
- Data visualisation, charts, dashboards, and visual summaries
- Project timelines, process diagrams, and theories of change
- Maps, fact sheets, policy briefs, and knowledge products
- IEC materials, training visuals, and campaign graphics
- Social media carousels, presentation graphics, and motion-ready assets
- Print-ready and digital files in the formats your team needs
Our Infographic Design Process
1. Understand the audience and communication goal
We clarify what the reader needs to understand, remember, or do.
2. Structure and verify the information
We organise the source material, prioritise key messages, and flag gaps or inconsistencies before design.
3. Build the visual narrative
We develop the hierarchy, charts, illustrations, iconography, colour system, and layout around your brand and audience.
4. Review and deliver
We refine the work through an agreed review process and supply polished assets for print, web, presentations, or social media.
Why Gateway Graphics?
Our strength is the combination of information design and field-level communication experience. We understand that NGO, government, research, and institutional materials must be visually engaging without losing accuracy, context, or dignity. The result is communication that works for donors, stakeholders, communities, decision-makers, and public audiences.
Frequently Asked Questions
Can you work with raw data or an unfinished report?
Yes. We can help organise information, recommend the right visual format, and identify what needs clarification before design begins.
Do you design for both print and digital use?
Yes. We prepare files for reports, publications, presentations, websites, social media, campaigns, and large-format display.
Can the design follow our brand guidelines?
Yes. We can work within an existing identity system or create a project-specific visual language when needed.
Turn Your Data Into a Story People Can Use
Share the information or programme content that needs to be communicated clearly for its intended audience.
INFORMATION DESIGN IN CONTEXT
Use infographics as part of a complete communication system
Good information design does more than decorate data. It helps programme teams, communities, decision-makers and public audiences understand evidence, processes and calls to action. We develop infographics for reports, workshops, IEC materials, exhibitions, campaigns and digital communication across India.
SWISSAID workshop IEC
Workshop information translated into a clear visual communication system.
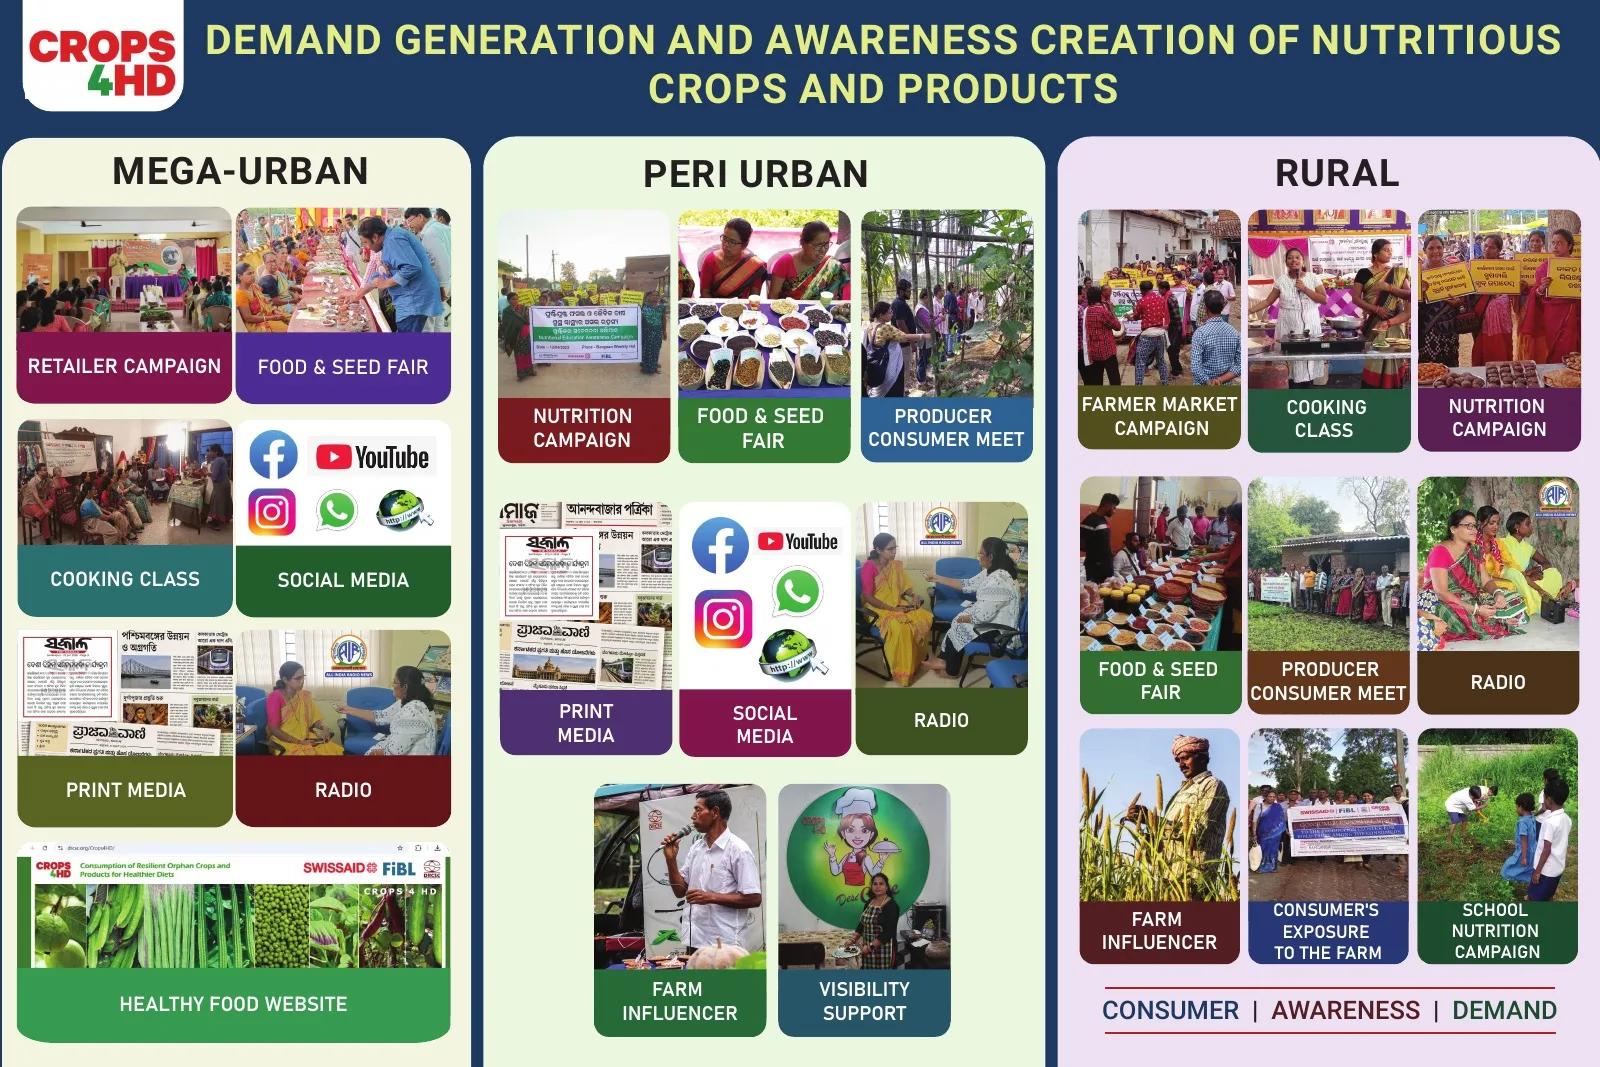
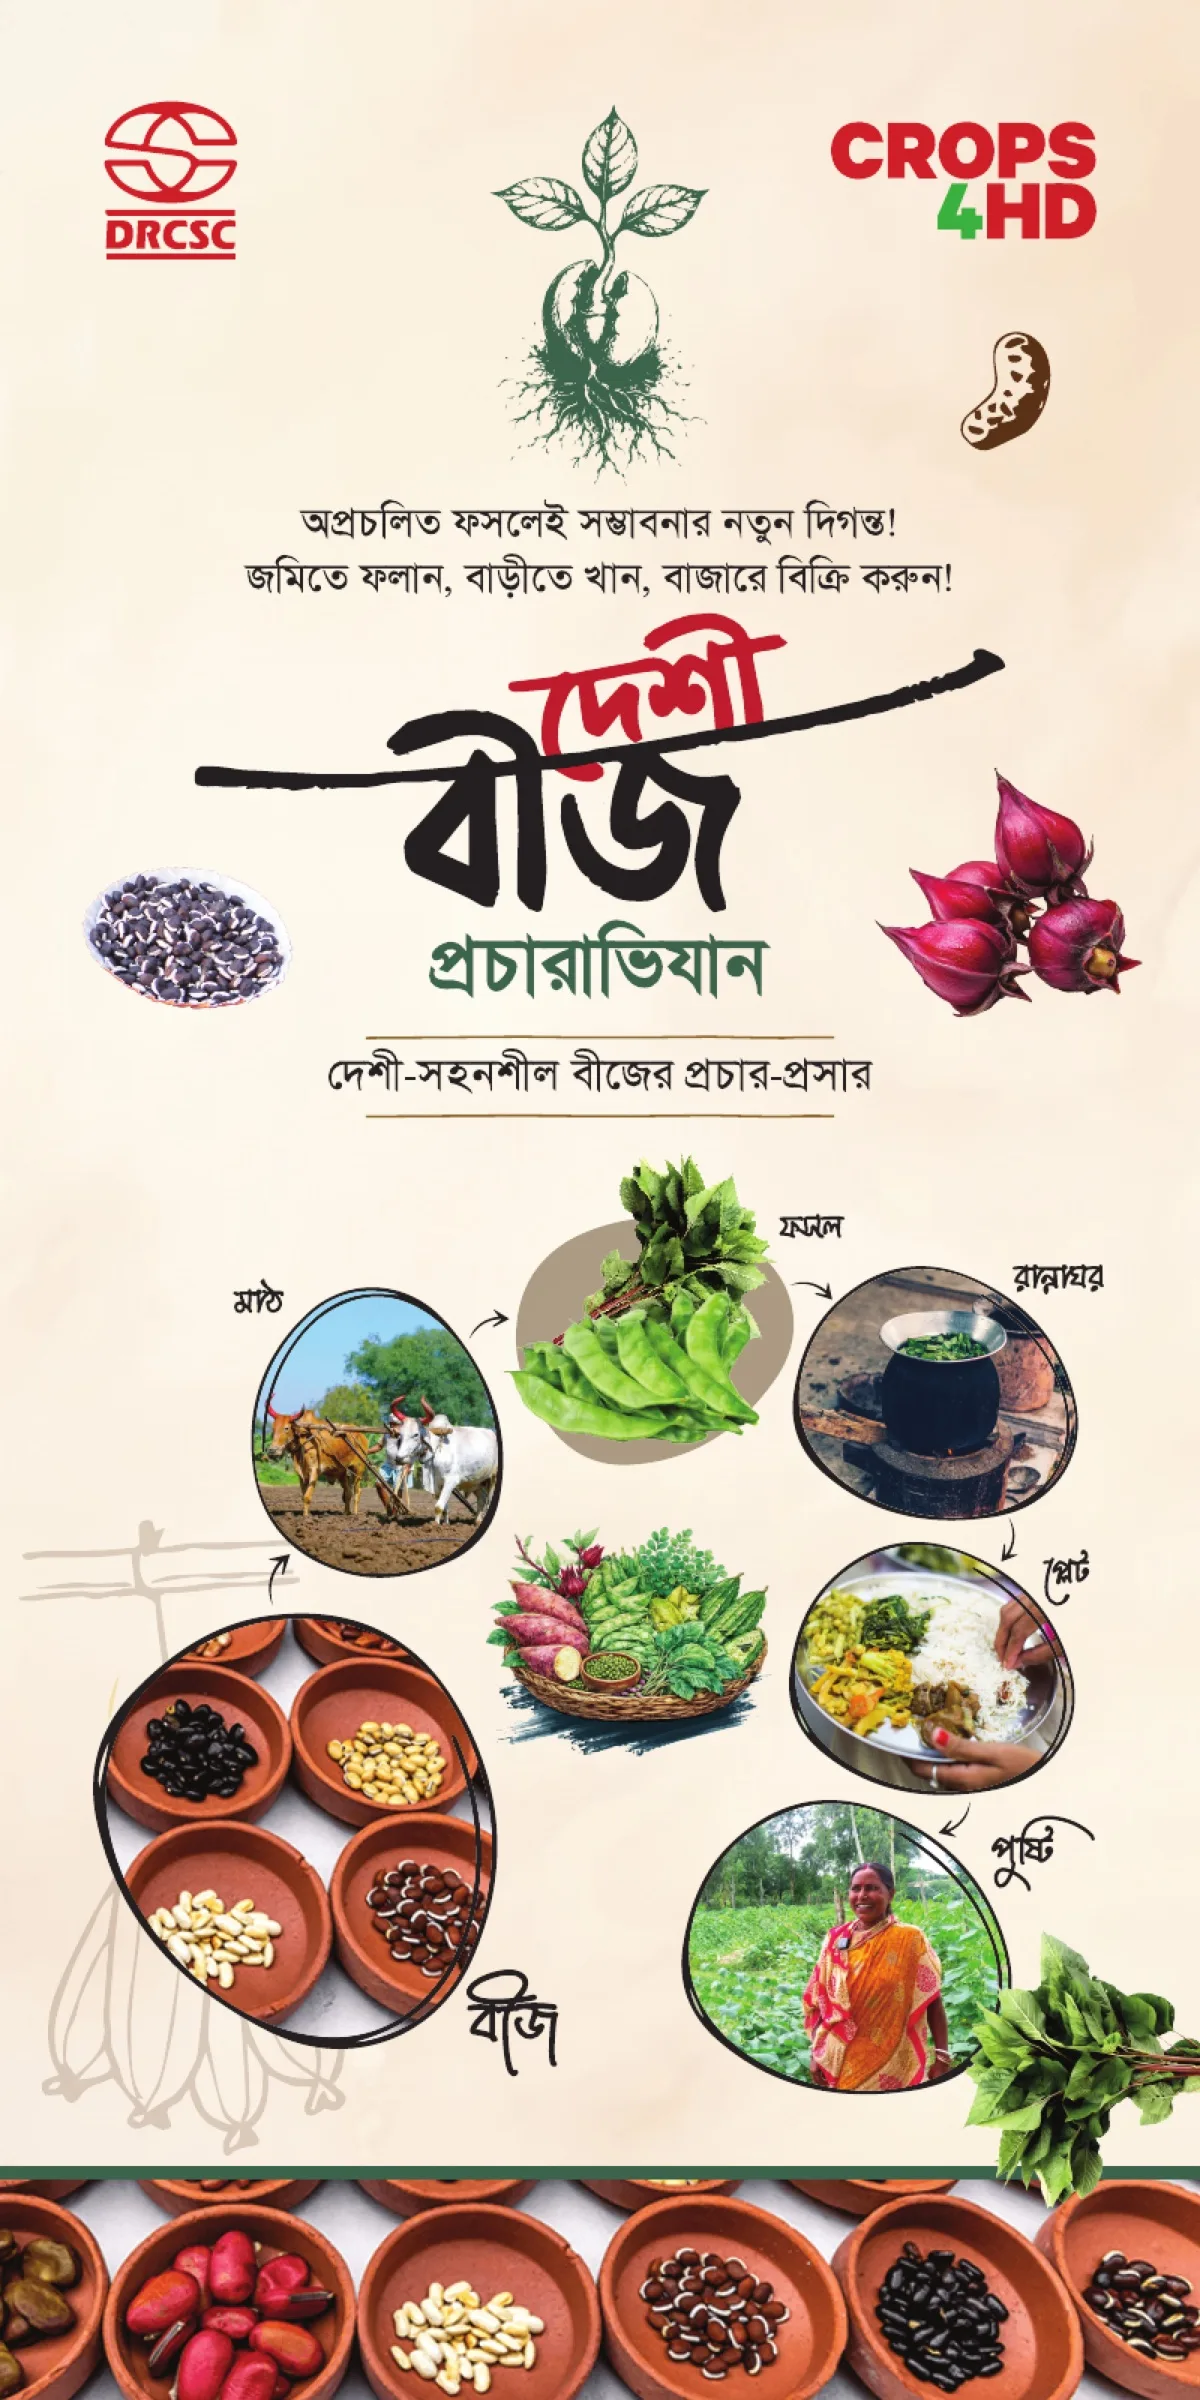
CROPS4HD seed campaign
Field knowledge and campaign messages designed for public engagement.
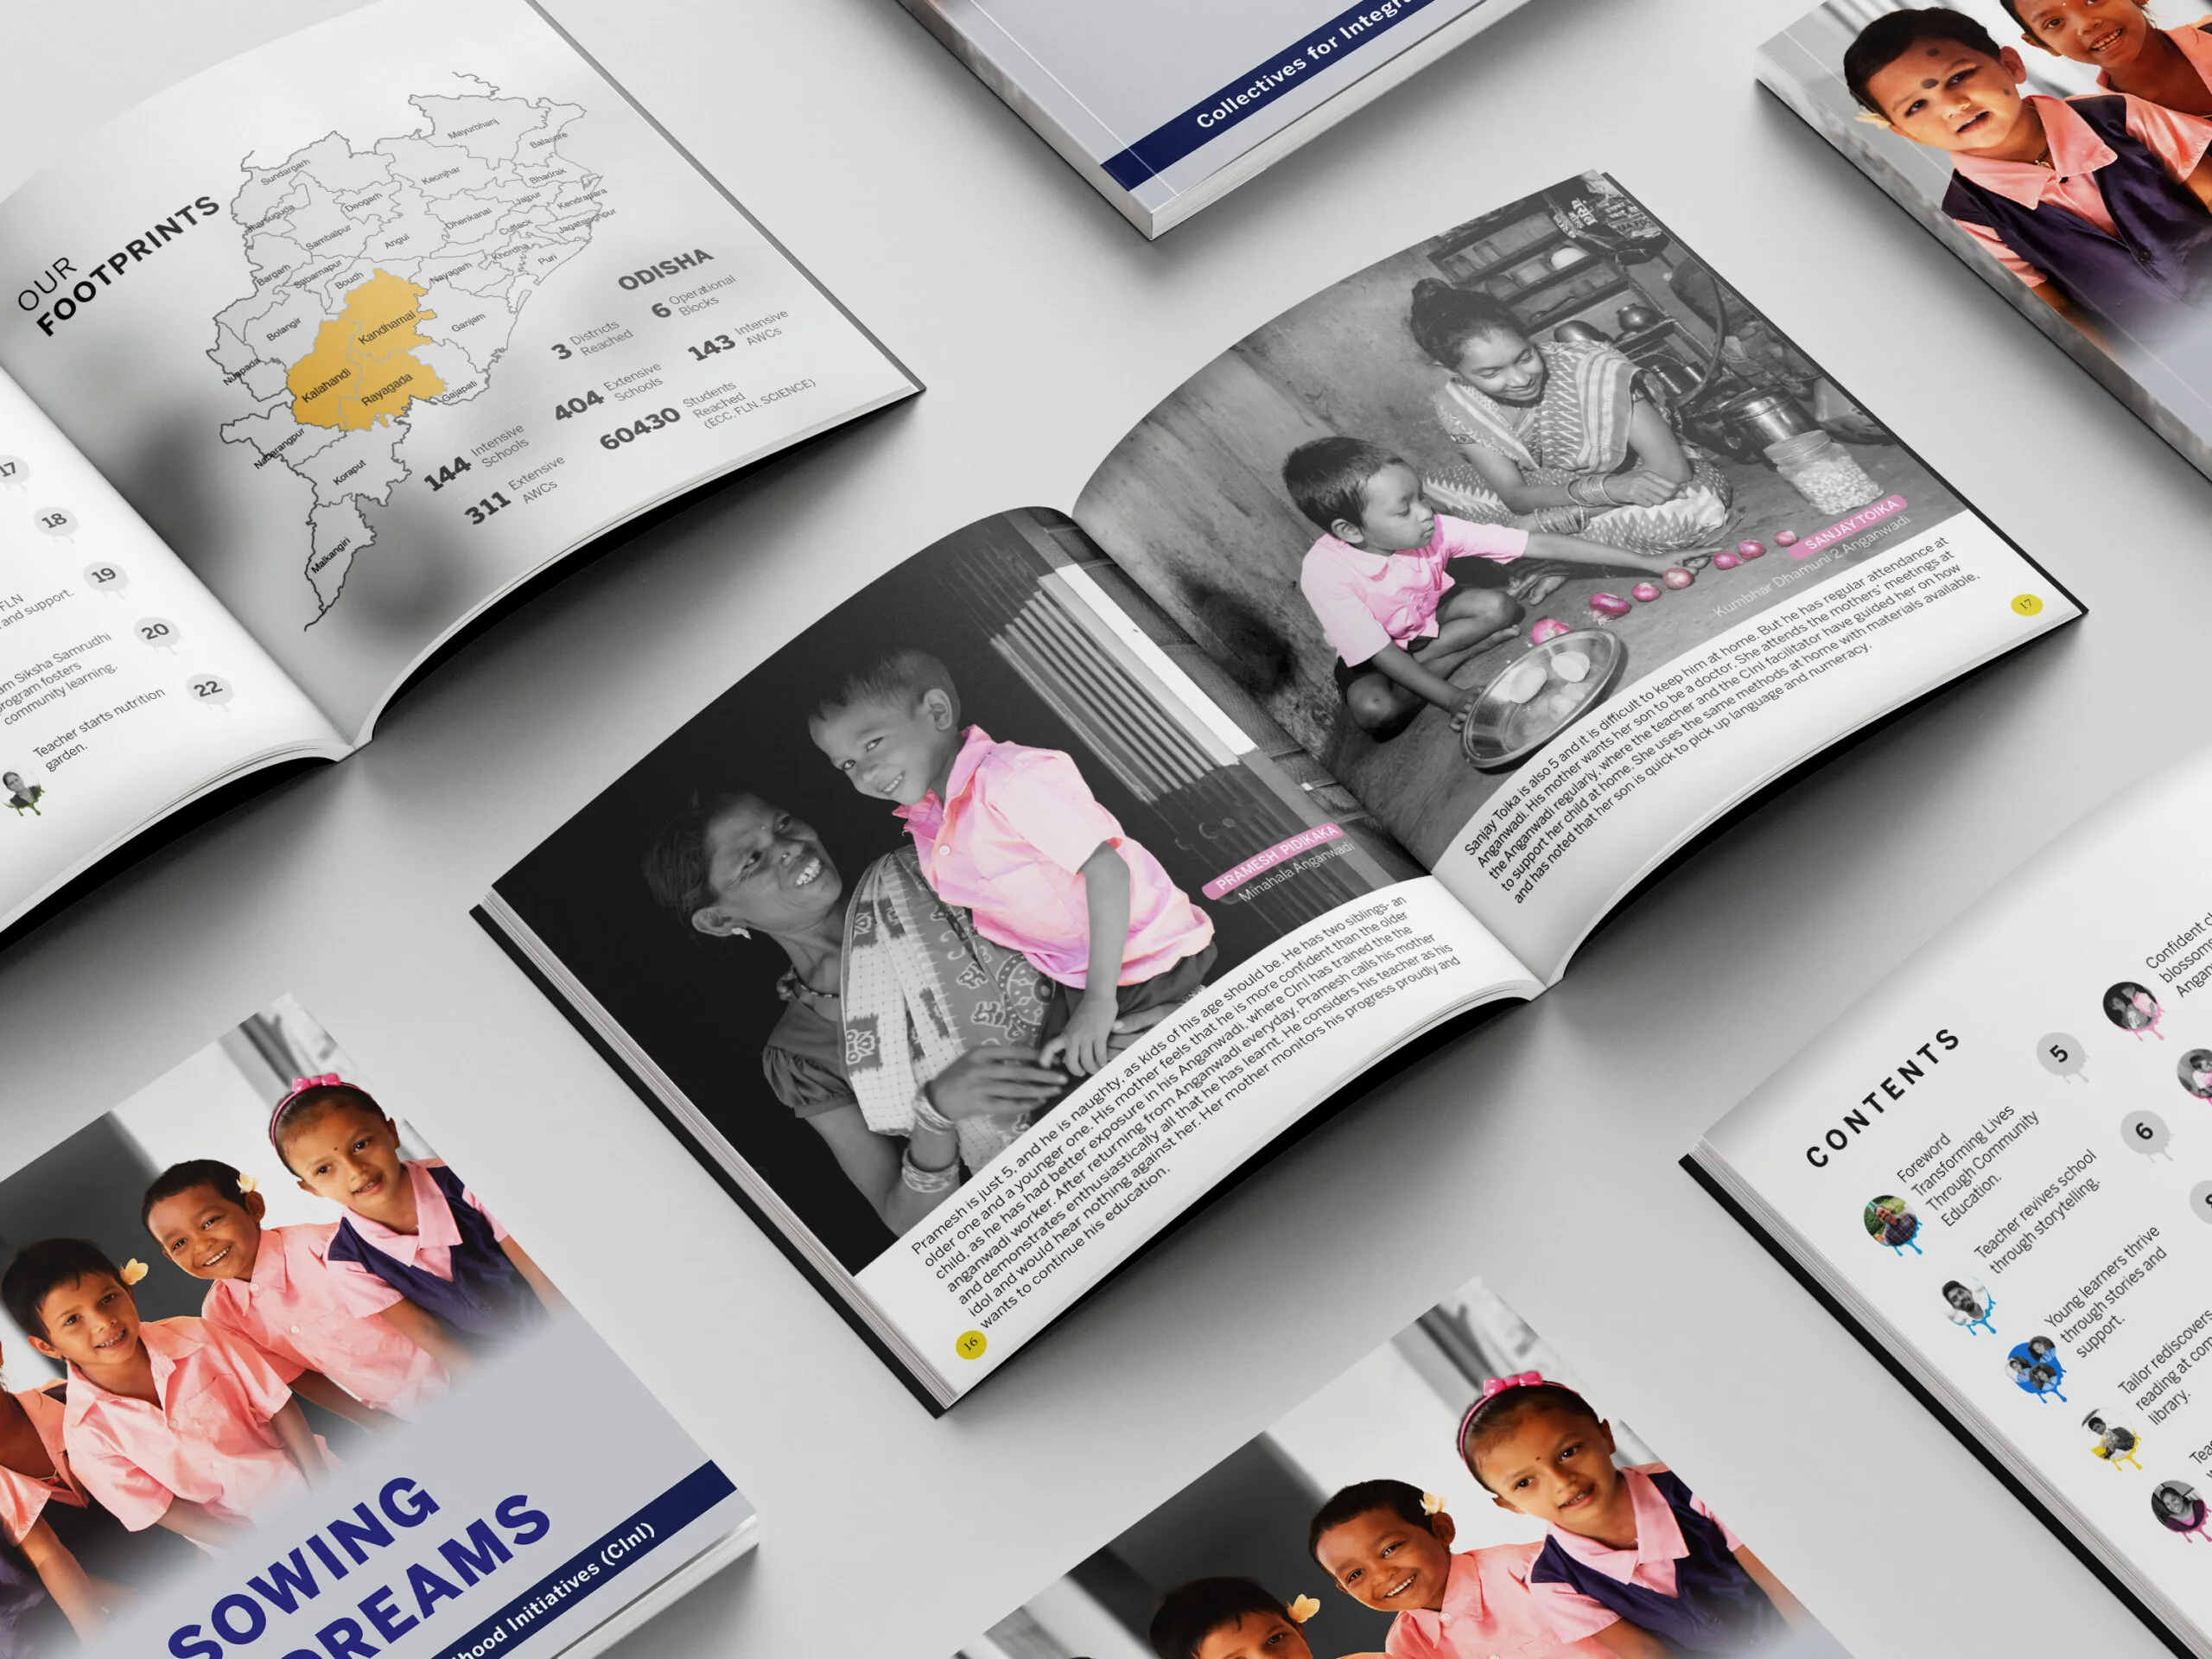
Editorial design
Integrate diagrams, charts and visual stories into a full publication.
Explore our complete documentation and communication services, or send us the data, draft material and audience requirement.